Quick Centrality Visualization
Plug-in Name : QuickCentVize
Author : CYRAM
Date : 2013-06-07
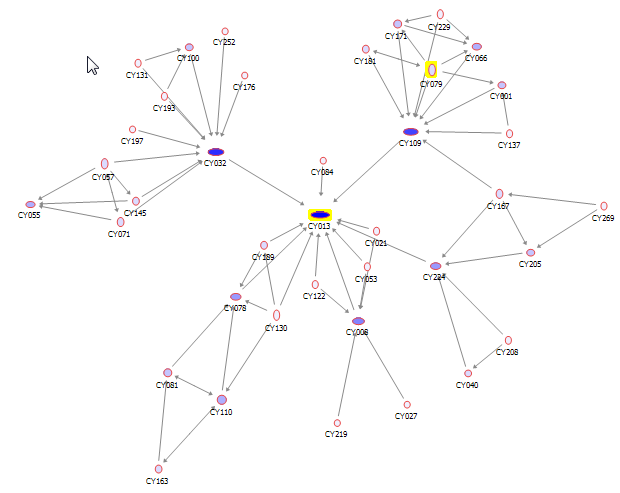
Description : This Plug-in changes the color and shape of nodes on centralization of each node.
----- How to Use ------
1) Open a map on the screen.
2) Go to Tools → Plug-in and select “QuickCentViz”
3) Choose the one of network to measure the centrality
4) Choose a centrality measure from Degree (In and Out, In, Out), Closeness (In and Out, In, Out), Betweenness and Eigenvector
5) Set the maximum and minimum node size
6) Choose color theme from Red, Blue, Green, B/W(Black and White) and Current(no changes on the color)
7) Click OK button
Note :
* If you choose Degree (In and Out) or Closeness (In and Out), the ratio of node's width and height will be changed.
Width represents the value for IN, Height indicates the value for OUT. (e.g. The flat shape means weak link with peripheries from that node.
* You don't need to select a network which is same with the network which is used for the map.
The selected network in the plug-in is only used for measuring the centrality in order to determine color and size.
* It works only for color and size. If there are changes on the shape, surface or others, they are maintained.
* This plug-in is also applicable for 3D map in NetMiner 4.

- 첨부파일
- QuickCentViz.nmx